Visualize Go process metrics in real-time
One day, it became necessary to have a tool to easily observe resource consumption trends of a Go process. I’m aware that there are tons of APM tools out there; also, Go has enough profiling tools including pprof. I poked around the internet but nothing worked as well as I would like.
I just wanted to see how the CPU usage, heap usage, and the number of Goroutines evolve over time without any tedious settings. Therefore, I settled on making a new tool myself and finally released it with the name Gosivy.
I mentioned nothing worked as well as I would like, but honestly, I found out statsviz, a web-based visualization tool published by @arl. This is pretty neat; you can draw a fancy chart by just adding a couple of code lines. I love this one. While it is designed to be simple and comes with a great UI, I worried about a couple of things:
- Regardless of you’re looking at the chart, stop-the-world has occurred in the target process every second
- It is designed to make the target process not only calculate the resource consumption but also visualization the charts.
- It requires some kind of browser because of web-based UI
Overall, I felt like the target process' load is too heavy, that’s why I settled on building a new tool that can be used as easily as statsviz and puts as little load on the target process as possible.
This post mainly goes into some details on how to use it.
Usage
First up, you head to the repository page and grab the gosivy binary with the way you like.

The tracking can be done by running the agent inside the target process. Fot that, you need to import the github.com/nakabonne/gosivy/agent package into the application you want to visualize metrics. Then execute that modified application.
package main

import "github.com/nakabonne/gosivy/agent"

func main() {
	if err := agent.Listen(agent.Options{}); err != nil {
		panic(err)
	}
	defer agent.Close()
}
Now you just need to launch gosivy process you just installed.
$ gosivy
After that, you will see Go process metrics' evolution over time in real-time. Keep in mind that you run the gosivy process as the same user as the target application.
You may wonder why it can run without any arguments. It’s because Gosivy automatically detects processes where the agent runs on, and starts using the process that is found out first as an argument.
Thus, if multiple agents are running, you need to explicitly specify PID of the process you want to diagnose. You can list all PID of processes where the agent runs on with -l option:
$ gosivy -l
PID   Exec Path
15788 foo  /path/to/foo
16841 bar  /path/to/bar
Then give it as an argument.
$ gosivy 15788
Remote mode
You are also able to observe from another host if you know the address of the target process.
You specify the address where the agent listens:
package main

import "github.com/nakabonne/gosivy/agent"

func main() {
	err := agent.Listen(agent.Options{
		Addr: ":9090",
	})
	if err != nil {
		panic(err)
	}
	defer agent.Close()
}
Give the address accessible from the gosivy process as an argument; then it will draw the same as the local mode.
$ gosivy host.xz:9090
How it works
This tool is designed based on gops. The figure below nicely illustrates how this tool visualizes:
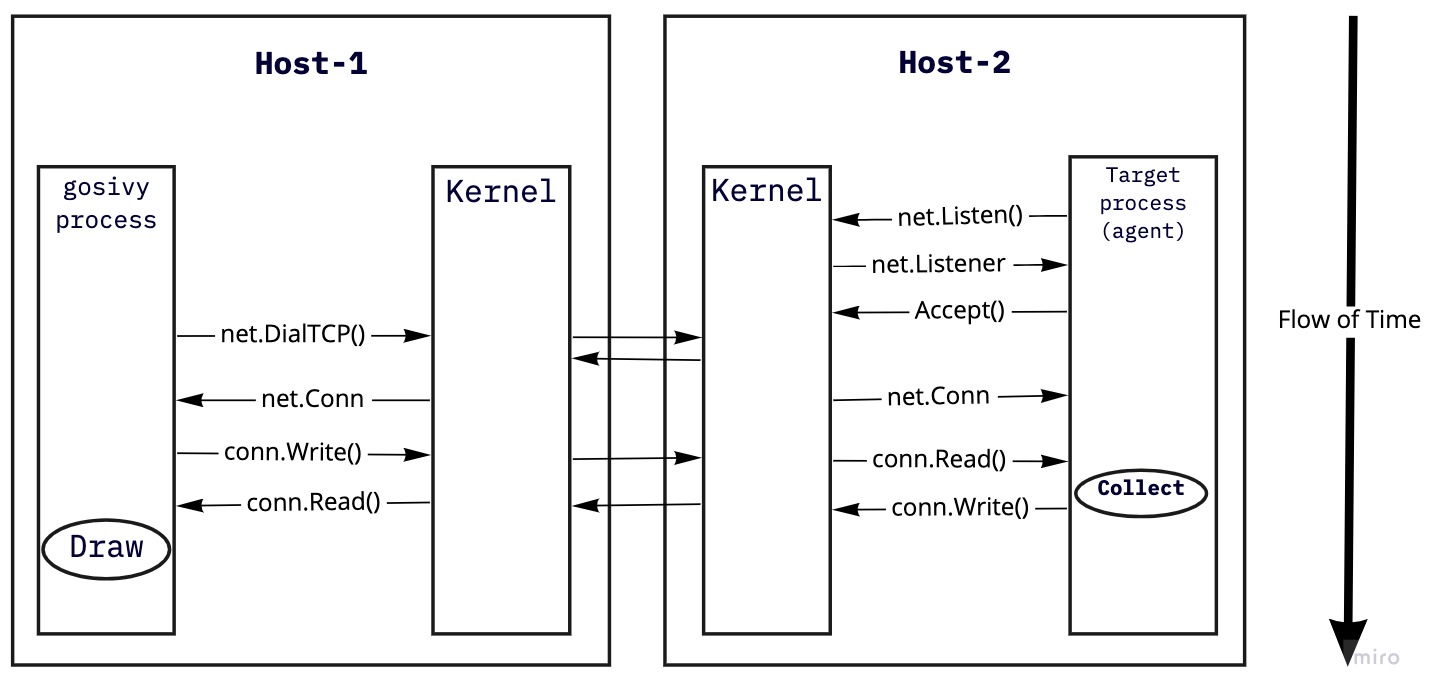
The gosivy process collects metrics by scraping from the agent, so the target process does nothing as long as you don’t start the gosivy process.
That is, the agent calculates the runtime statics when only you’re looking at the chart.
Also, because processes communicate via their TCP sockets, both local and remote hosts can be accessed via exactly the same interface.
Roadmap
Originally, this tool was made for making debugging the tool named ali easier; so honestly, it already has enough facilities for that. However, I talked a little bit with the author of statsviz on the Gopher’s slack; seems like he feels some possibilities in this tool that explicitly distinguishes visualization and metrics collection. Gosivy is designed to make the part of visualization pluggable. Besides, recently, a couple of powerful tools such as go-echarts are launched, hence I’m looking into making it possible to plot various kinds of places.
Thanks
Gosivy has been built on many great ideas. @arl definitely inspired me. Thank you for making a great tool! Also, Gosivy is based on gops’s design philosophy. A big “thank you!” goes out to all those who inspired me!